Let's be honest, every company says their product is easy to use. I recall a time that a friend bought a high end European espresso machine. The salesperson told him "this machine is specially designed so you can easily make the perfect cappuccino". The salesmen continued to explain the savings that would occur by skipping the $5 coffee line every morning. Three hours and several first degree burns later my friend gave up and returned to the 7:00AM morning lineup at his local coffee joint.
In a world where all products are touted as being easy to use and simple to understand, how can you trust anyone when they make a similar claim about theirs?
As a relative newcomer to the process data historian industry, I have found myself in a very unique situation, I have no previous experience or background with a data historian or trending platform. Essentially, I am as wet behind the ears as they come. I have never worked in a control system environment, have never used a SCADA system, and up until three months ago, I didn't even know that operational historians or historian software even existed.
I thought my unique perspective would make for an interesting and honest review of the Canary Labs trending systems, highlighting both it's positive and negative attributes, as well as a report on the learning curve to use the Axiom platform.
Installation
Initial Setup
When I launched the Axiom application, I was presented with a large white screen with the trademarked Canary yellow header at the top. Across the bottom of the page was a small calendar icon on the far left and far right, as well as a time counter at page center with directional controls on either side of it (see below).

To get started, all I had to do was right click on the screen and select "Add Trends" from the new context window. When I did, a window was launched that held all of available process historians in my system. I choose the operational historian I wanted to access, and was then presented with its available data sets. In this example, I selected our Demoserver historian, and then chose the Wastewater data set. To the right, all the available tags under the Wastewater data set are presented. I can then select any tags I would like to trend (you can use the mouse to highlight as well as hold "Ctrl" to individually select several tags).
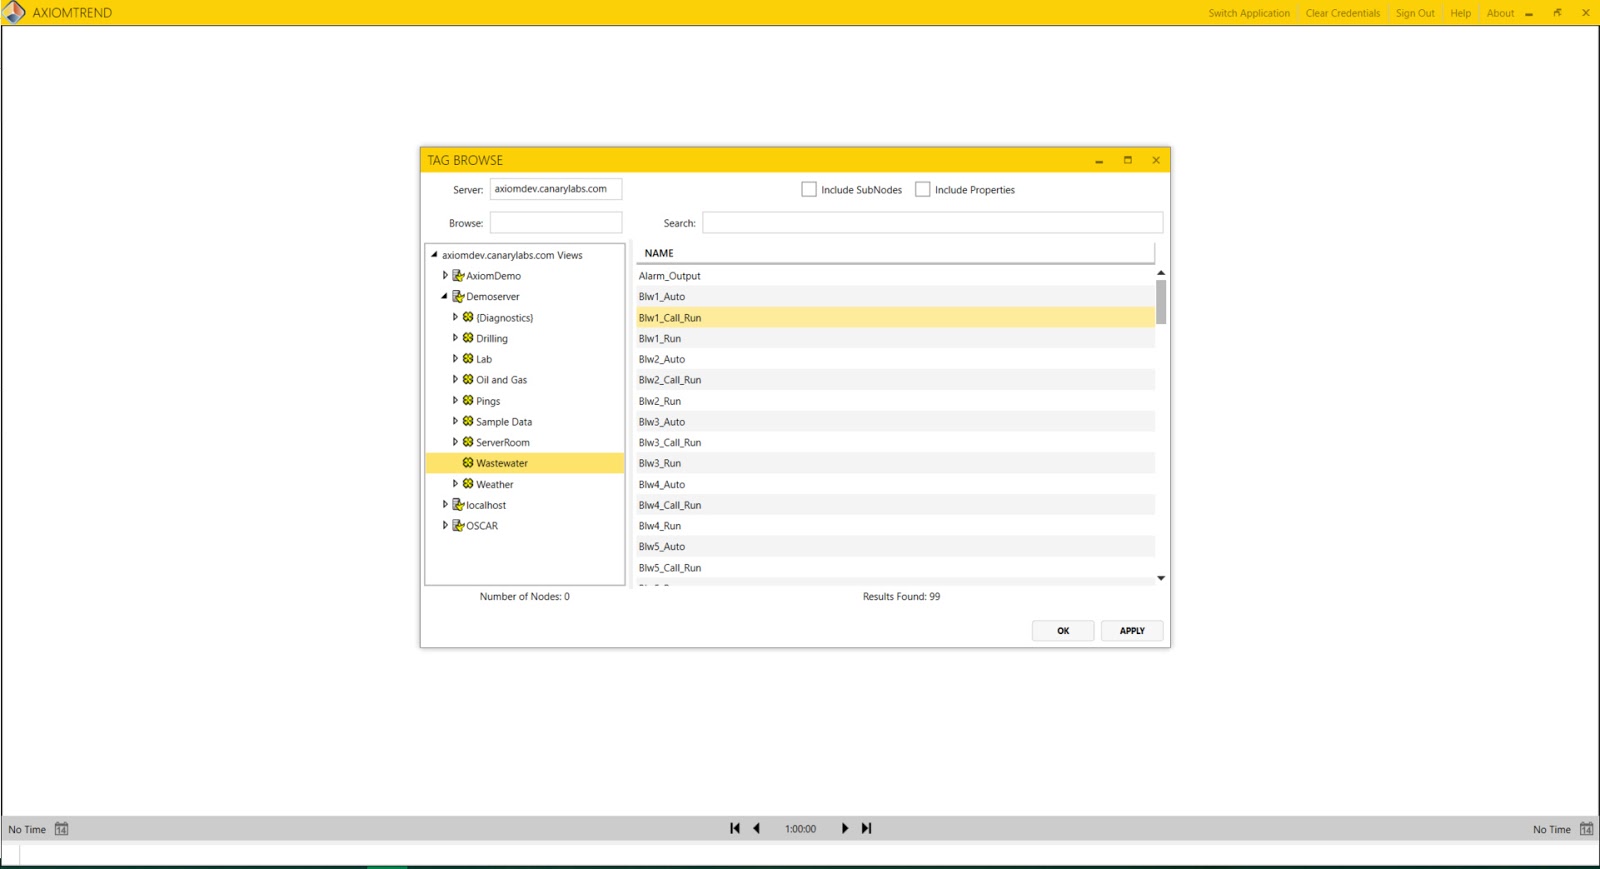
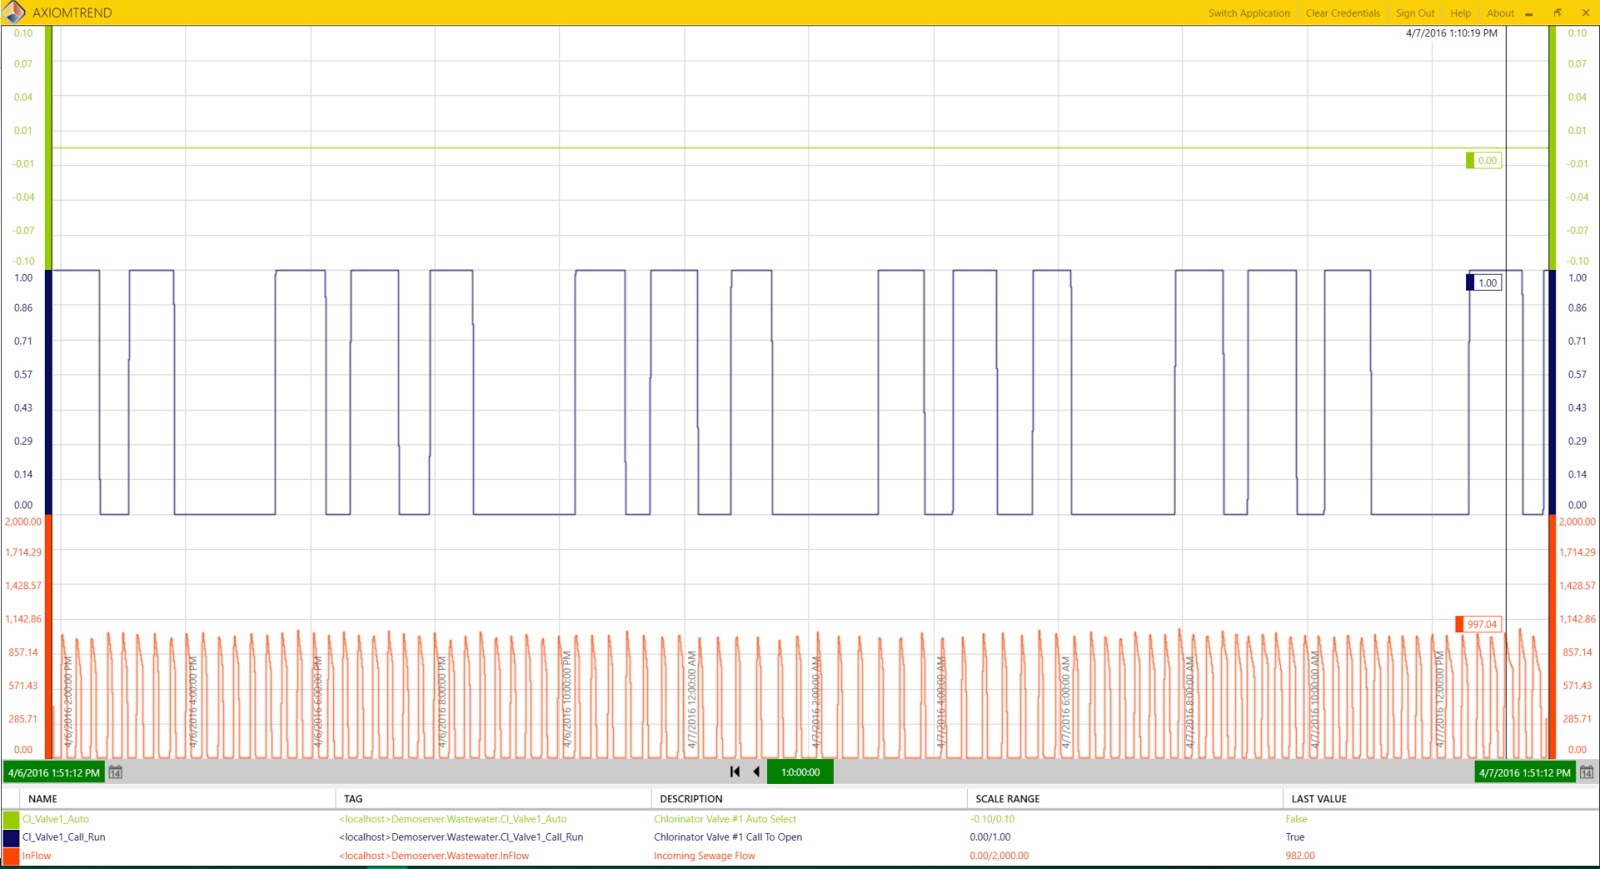
In this data set, all the tags have been labeled and it is easy to find the three that I am looking for. Once selected, I simply click "OK" and my trend chart appears. The default view is for the past one hour of data collection. I easily was able to change that time frame to the entire day by entering "1d" at the bottom of the Axiom software and pressing enter. Had I wanted to see 30 seconds I could have entered "30s" or even "72h" for the past 72 hours.
The trend that I now have before me is showing me three separate data tags for the past one hour. A quick right-click and I can put the chart into "Live Mode" so that new data is constantly refreshed and fill the screen from the right edge.
One of the things that I have found very nice about the Axiom software platform is how simple it is to use. Keep in mind, I have never used a data historian or any tools of a historian previously. In fact, this is my first exposure to any software trend analysis or trend visualization. I have previously watched a Canary sales representative on a webinar but have had no first hand experience. In less than five minutes, I have been able to build a trend chart using the Axiom historian tool application.
To go a bit further, I decided to take a trip to Canary University, Canary Lab's video based training platform (http://www.canarylabs.com/support) and watch a few short, two to three minute videos.
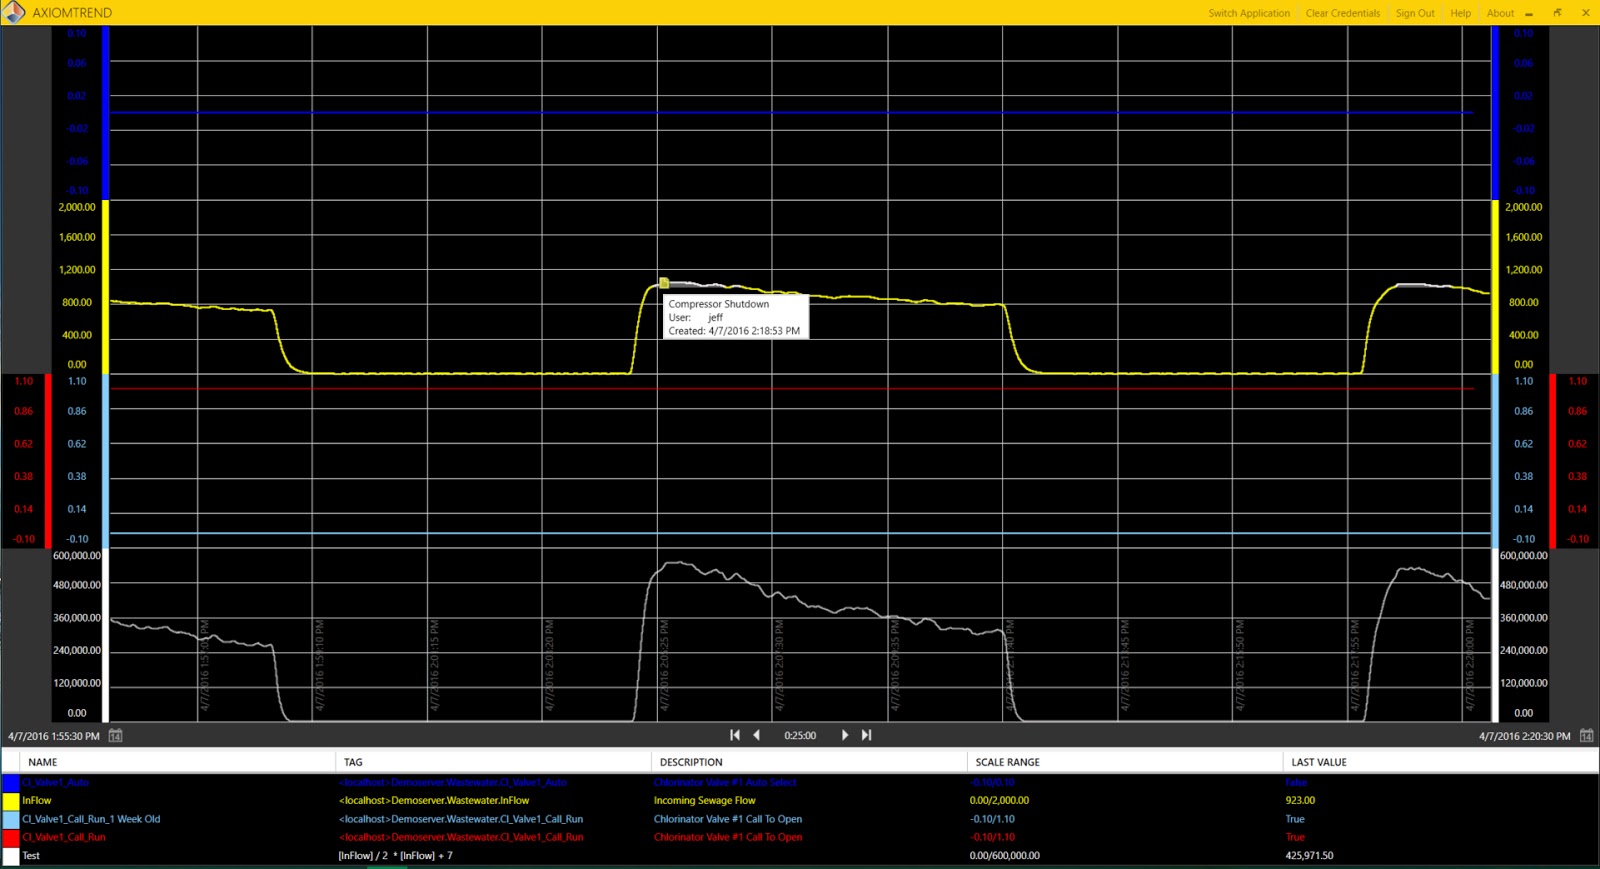
Upon doing so, I was able to successfully customize my trend chart to include a calculated trend, and performed a time-shift (allowing me to see the same data tag from a previous time period overlaid on current data). I also adjusted my background and set up a "High Limit" for the InFlow tag to visually indicate whenever the value exceeded 1000. I thought this would be extremely helpful in real-life application. The Axiom software even allowed me to place an annotation for future reference.
When finished, I saved my chart. Doing so prompted me to choose whether I wanted to save the chart in either a Private or Public environment. After checking with the Canary Labs team, I was told about a very nice feature inside the Axiom software. I can choose to create read only charts that can then be shared with other members of my team. Essentially, I can create a universal chart and roll it out to the entire facility without ever having to worry about someone messing it up! I can also save the same chart privately and continue to edit it as I need to. I see a lot of value in this feature and can really see value in on site application.


