Water Utilities need historical and real-time data to be empowered to make a difference to their customers. Analysis needs to take place in near real-time and in minutes instead of hours or days. If an employee has to go to their IT people or some programming guru to ask for data, it is not going to happen or be effective. By the time the data is retrieved, the thought process has been lost or the original question of investigation is probably not there anymore. Cost effective analytics can only occur if this basic concept is applied. Get the right information to the right people at the right time!
Many utilities are reaping the benefits of time-series data. This data can be used in many ways and is being recognized as game changing strategies for companies in the utilization of this information. The data can be used for the following examples:
Gaining valuable operational insight
Assistance in decision-making
Production optimization
Discovering nuances never understood before
Safety and compliance procedures
Less downtime
Equipment monitoring and maintenance
Tracking of equipment failure or operator errors
Improving the bottom line
Environmental compliance reporting
Using data extracted from new sources
Business intelligence
Measurement of strategies
Smarter and faster decisions
Competitive advantages
The list goes on and on…..
These sources of data can lead to interesting insights to empower decision-makers at all levels. More important is what new ideas or information analysis techniques will lead the way in the future? What are the next steps after this investigation…better predictive analysis, forecasting, faster decision making, and better artificial intelligence?
Basically, it doesn’t matter what else you do, if your employers can’t find the information they need in time to influence their decisions, you have failed to empower your people. It’s that simple.
Speaking of simple, the KISS (Keep It Simple Stupid!) principal needs to be applied when selecting analytical tools. One of the best basic beginning analytic tools is the use of trend charts. The trend tool needs to be very intuitive, easy to use, with the ability to make ad hoc changes. Vendors need to make a conscious effort to monitor how users utilize their application and keep it simple. If today’s plant operator requires more than 1 hour of training to best utilize the application, their effectiveness will be lost. The operator and engineers need to be able to focus on what the data is telling them, not how to operate a complicated application. The days of companies sending their employees to remote locations for a weeks’ worth of training are over.
Water and Wastewater utilities need to partner with vendors that take the extra effort to design and re-design their standard products for the end-users ease of use. It should not be what is easier for the programmer to develop and the utility personnel has to accept it as is. Also by developing relationships with vendors who can be flexible, utilities can generate innovative time saving features which in turn benefit both their customers and plant management by reducing their costs. Many times, a utility doesn’t know how one upset causes repercussions throughout the plant. Getting information and solving issues with the analysis of time-series data leads to other questions being asked. This in turn leads to the next step which is: “What do we do different or how do we prevent the problem from happening again?”
“I would not want to run this plant without the Canary software and I depend on it every day. The software is worth more than gold to me.” - Plant Operator
A large water / wastewater facility had a large pump valued at over $25,000 dollars that failed and stopped working. When the plant operator was asked what happened, the reply was the pump just failed. Normally this story would have been accepted and written off as an equipment failure but this facility had historian software in use. The SCADA superintendent decided to look to see what the data had to say about the situation. Within 30 minutes, the superintendent had figured out what really happen based on the data. The operator wanted to lower a water tank level below its normal levels for some reason, but the PLC had been programmed to shut off the pump when it reached a certain level. The operator was able to override the level by putting it into a manual mode. As things happen, the operator was distracted by other events and forgot about the situation until later when the pump failed. The operator admitted to the mistake after the data was presented. The lessoned learned was to program another stopping point for the pump in case of a manual override to prevent the failure from happening again.
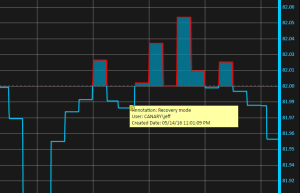
Many times, data is collected for regulatory or for EPA reporting purposes. Having reliable data and written explanations of data variances or fluctuations is a great asset and can reduce or eliminate possible fines for violations. Missing data is never good and having a system that “just works” consistently and nonstop is a great asset and value. A feature where annotations can be added and stored with the same time-series data can develop trust with the EPA personnel. Many times when someone wants to know why the data reacted a certain way months later, it is very difficult for an operator to recall what happened during the situation. If the Historian and the trend clients contain the annotation features, the explanations are right there with the data. Many times the chart data will change when a recalibration of equipment happens and having an annotation on a chart describing why there is a discrepancy in the data goes a long way with EPA inspectors.
 |
| Click on image to see an example of an Axiom annotation. |
“The added access to historical data trends of the plant equipment by the maintenance and engineering staff, has improved troubleshooting methods and enhanced the ability of predictive maintenance.” - Electrical Engineer
Another valuable tool included within some historians is a performance monitor for your PC. Some charge for this service, others include it for free. There have been some utilities where the IT supervisor records manually on a regular basis the health of the PC such as its CPU usage, memory usage, available disk space, etc.. Water Utilities utilizing historians have the records of the health of their computing hardware on a second by second basis and can enjoy the peace of mind and even being warned when certain limits are being exceeded.
Most small wastewater treatment facilities are not manned 24/7. The availability of smaller tag count historian is especially valuable in these situations. The typical initial response from these small plant operators is that historian and trending software is an unnecessary expense that will not do much for us. Those that try the software and start collecting data are asking questions about the data and what was happening in the process. After a few weeks, they are starting to better understand events that were happening in the plant.
Local operators state that before the historian and trending software were available, I could only see what was happening at that instant. I did not have the information that led up to an event. The trending package allows me to go back in time and see what happened over the past minutes, hours, overnight, or over a weekend. Also when my trend charts show that the data from the system is not typical, I can quickly determine the problem and resolve it before it becomes a major problem.
“I was really impressed with the ease of use and easy setup procedures.” - Senior Analyst of Process Control
Another value benefit of historical data is the ease of submitting environmental reports. Before they were hand calculated requiring a few days of tedious work. Now with the available historical data along with utilizing a manual lab data entry program for the daily lab test results, the reports are automatically generated and formatted within a few seconds.
No matter what the size of the facility, from multiple sites and collection points to a single PLC in a small plant, the value of data and story it tells is absolute.
If you would like a live demo of either Canary's data historian or plant historian software, as well as our data trending software, Axiom, easily schedule below.


