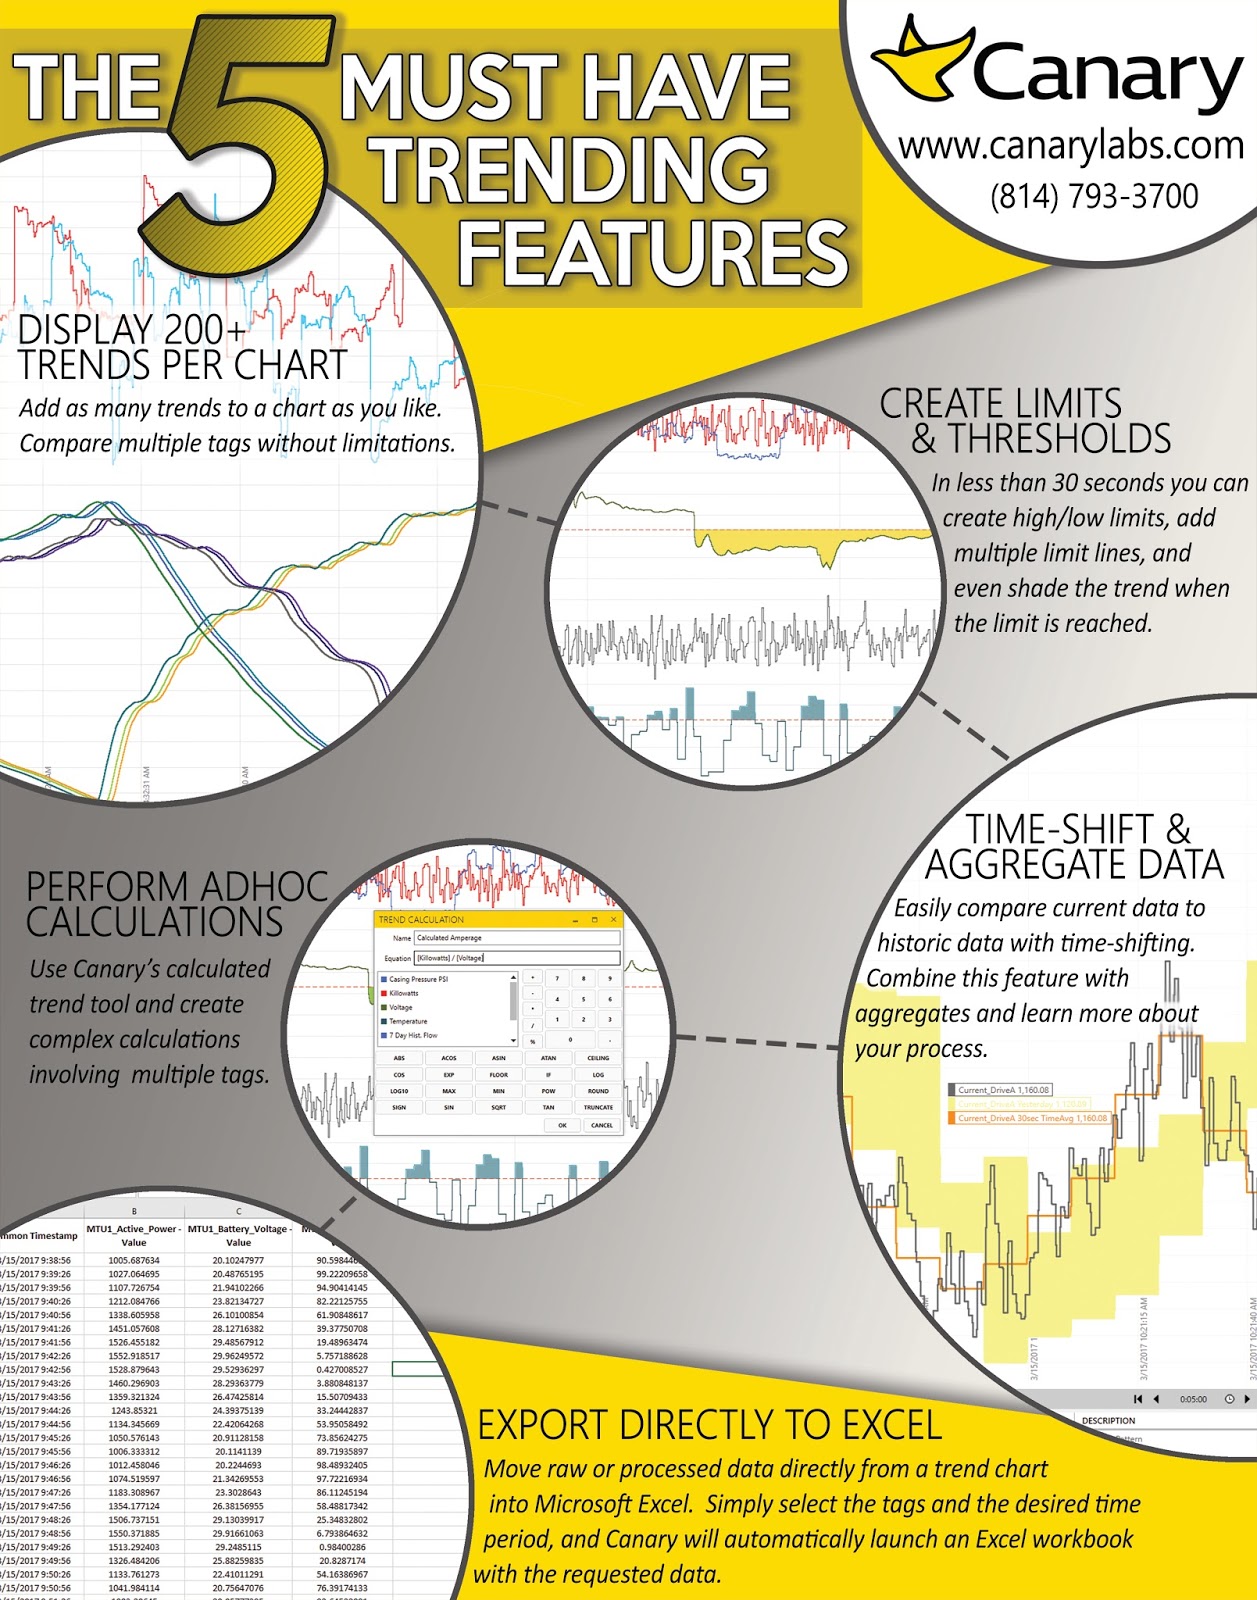
For over 30 years Canary has specialized in providing fast and easy to use trending tools. Below are five features that continually receive praise from Canary users.
Display More Than 200 Trends
Your screen resolution is the only restriction to the number of trends you can load. Canary allows you to full or auto-band your trends so you can decide how your screen should be designed for optimal trending performance.
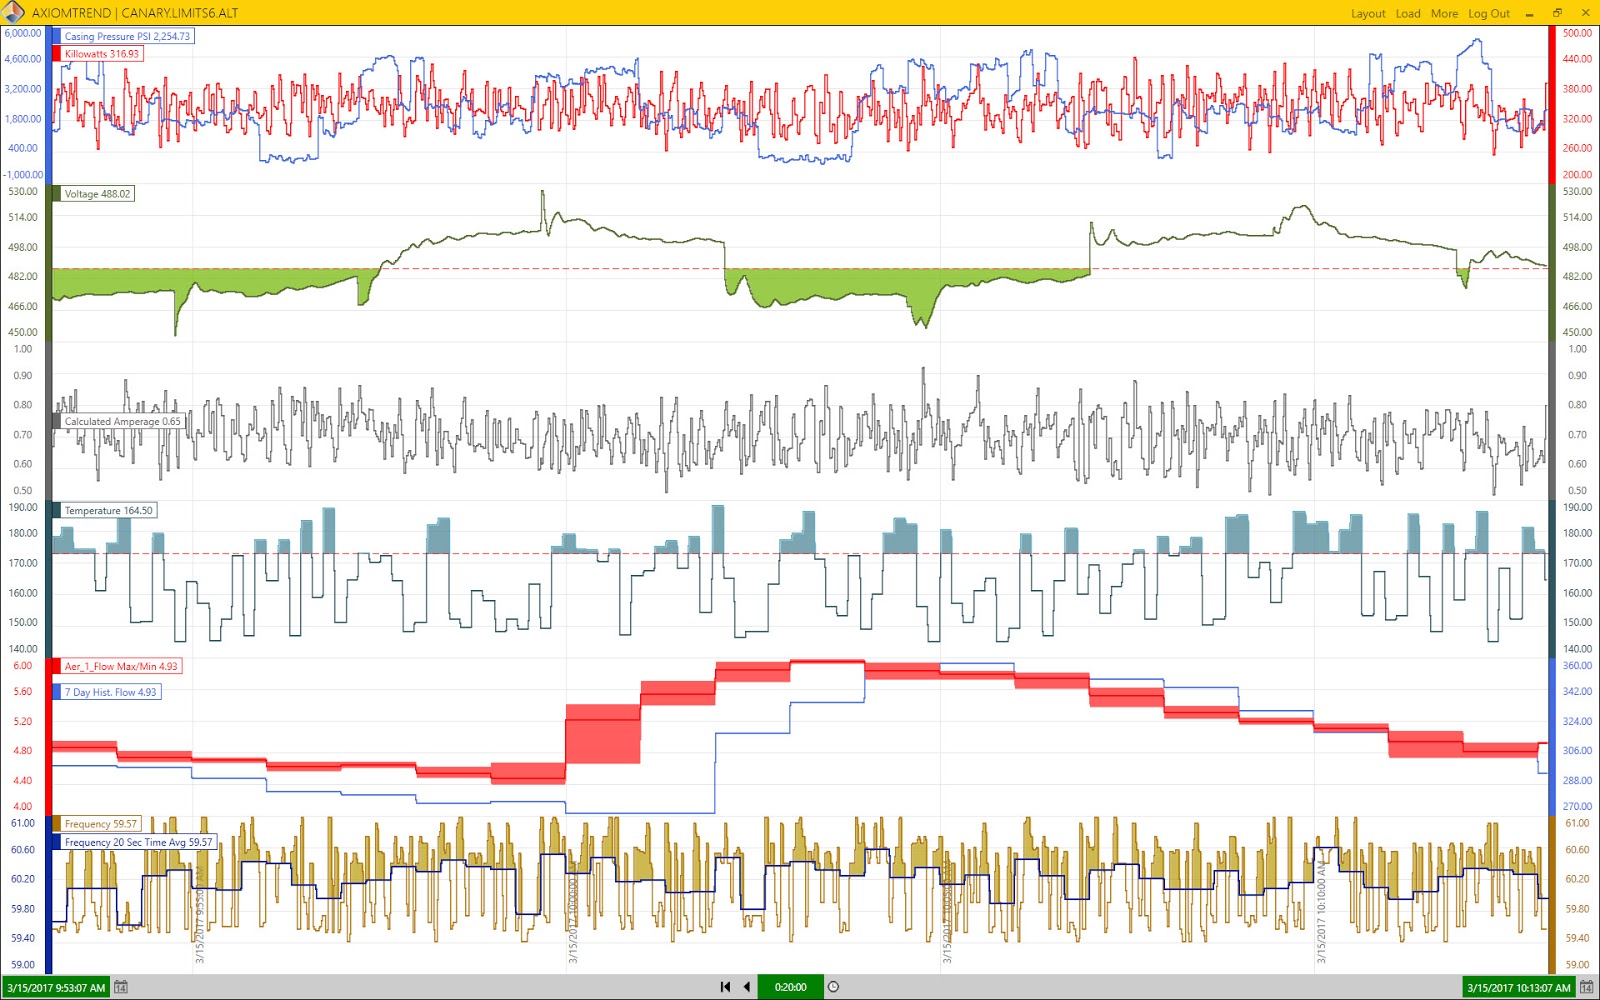
Define Limits and Thresholds in Seconds
In less than thirty seconds you can create high and low limits for each trend, add multiple limit lines to frame operating thresholds, and even shade the trend when the limit is reached. Canary provides a simple interface that gives you full control of features like line type, color, and even thickness. Beyond basic limits, you can even apply one trend as a limit for another!
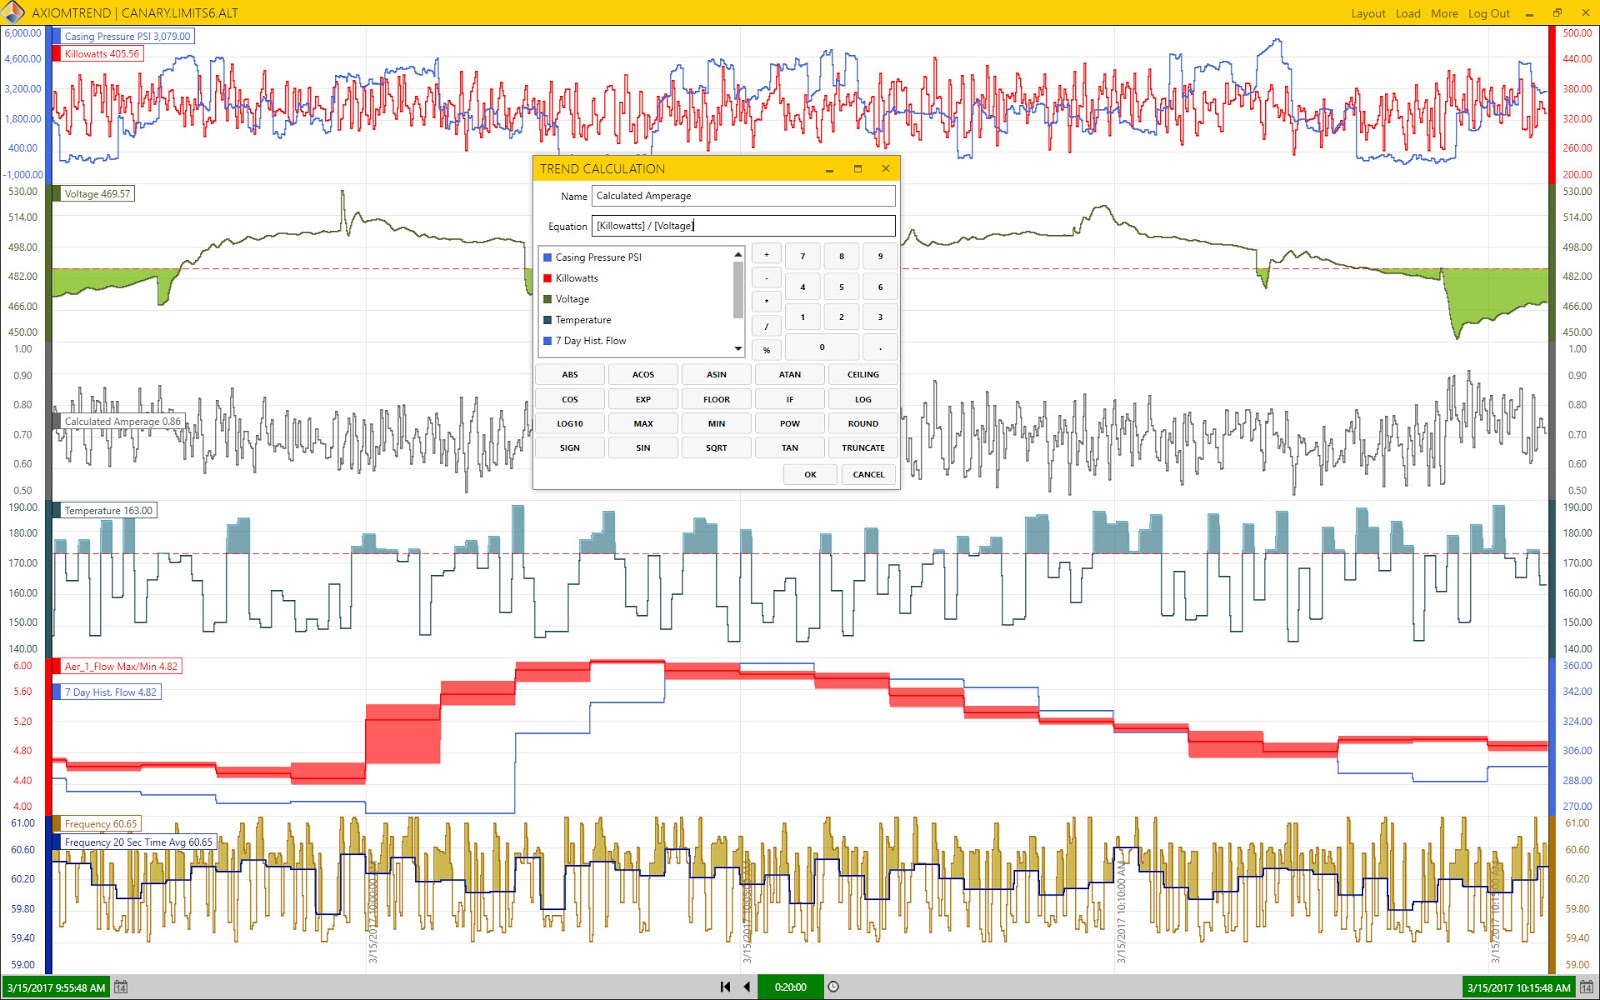
Perform Calculations
Need to calculate pump efficiencies or power factor ratios on the fly? Use Canary’s calculated trend feature and create complex or simple calculations involving multiple tags. Choose from more than 20 mathematical operators such as SIN, TAN, SQRT, COS, IF, MIN, MAX, and more. Once the formula has been defined it immediately calculates a new trend, even providing historical data and the ability to export the newly calculated data.
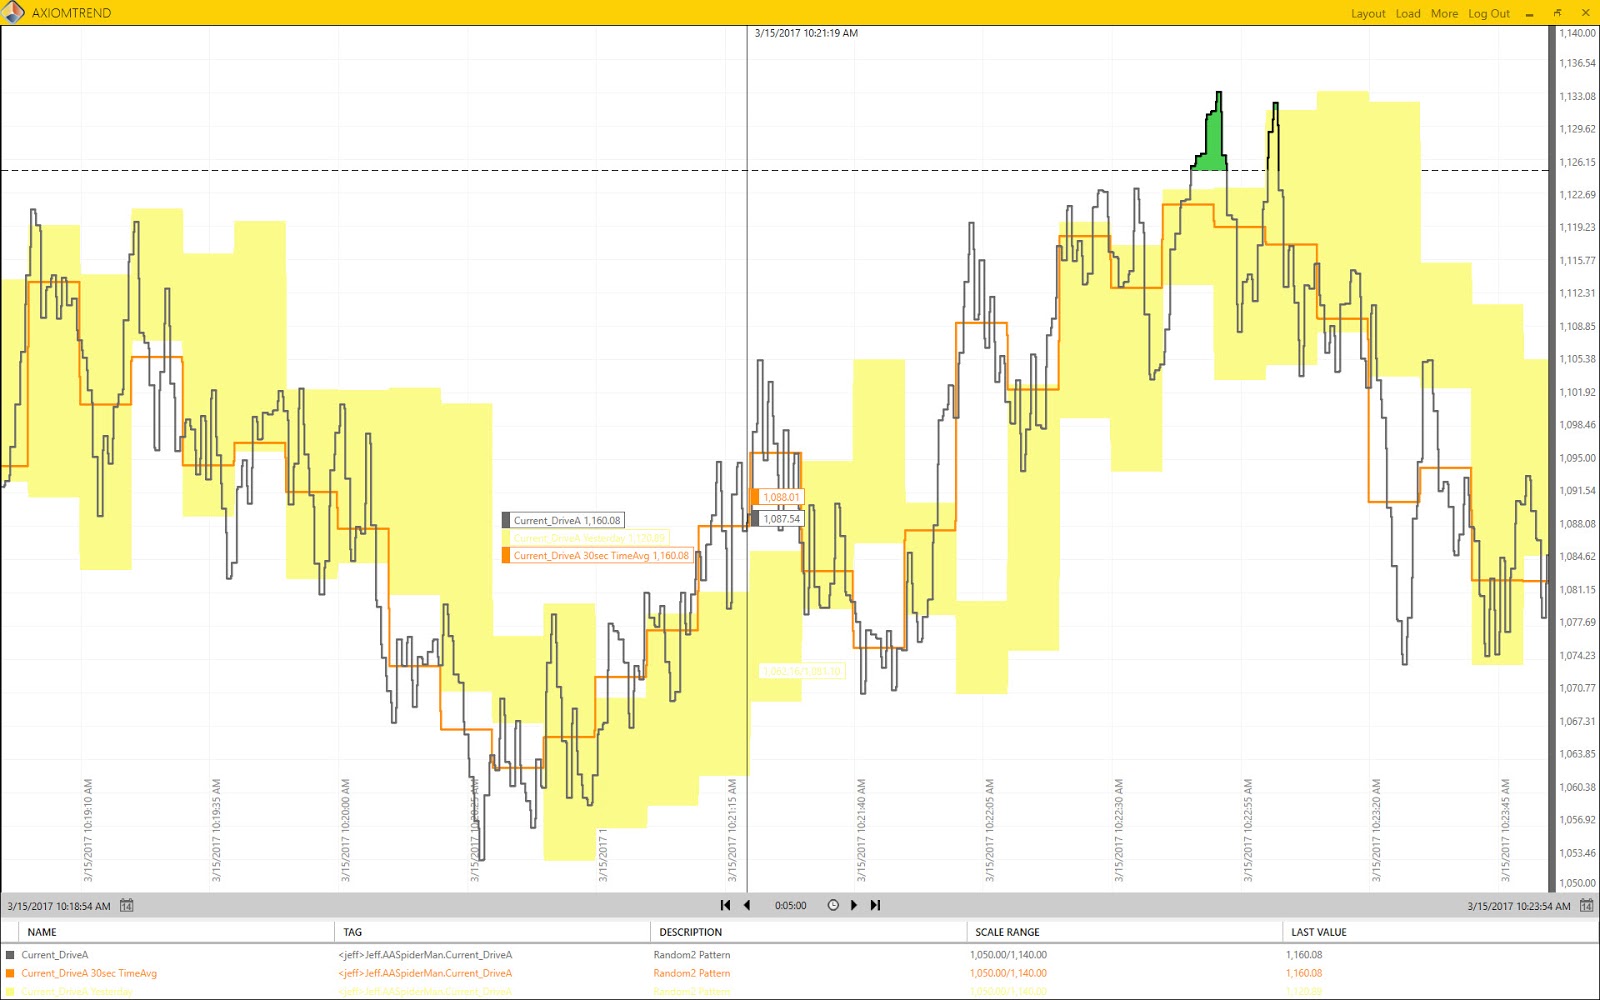
Time-shift and Aggregate Data
Easily compare current data to historic data with time-shifting. Canary allows for the same tag to be loaded multiple times on a single chart. Once loaded, you can quickly time-shift one trend and band it with itself to create a custom graph showing live data overlaid with historic data . Add to this feature the ability to aggregate data based on time interval, and you can process data into Max/Min, Range, Total, Count, TimeAverage, or one of over thirty-five options.
Export Directly to Excel
Want to move raw or processed data quickly into Microsoft Excel? You can export any trend chart directly into Excel using Canary’s built in export tool. Just select the tags and define the time-period, and Canary automatically launches an Excel workbook with the requested data. Or, bypass the trending tool completely and import raw and processed data directly from the historian into Excel using Canary’s Excel Add-in. Built right into the Excel ribbon bar, the Excel Add-in allows you to search any historian on the network and import the data directly into the workbook.
Many Other Features
Contact Canary today and learn about the many other features offered, including annotations, chart sharing and permissions, and custom dashboards.