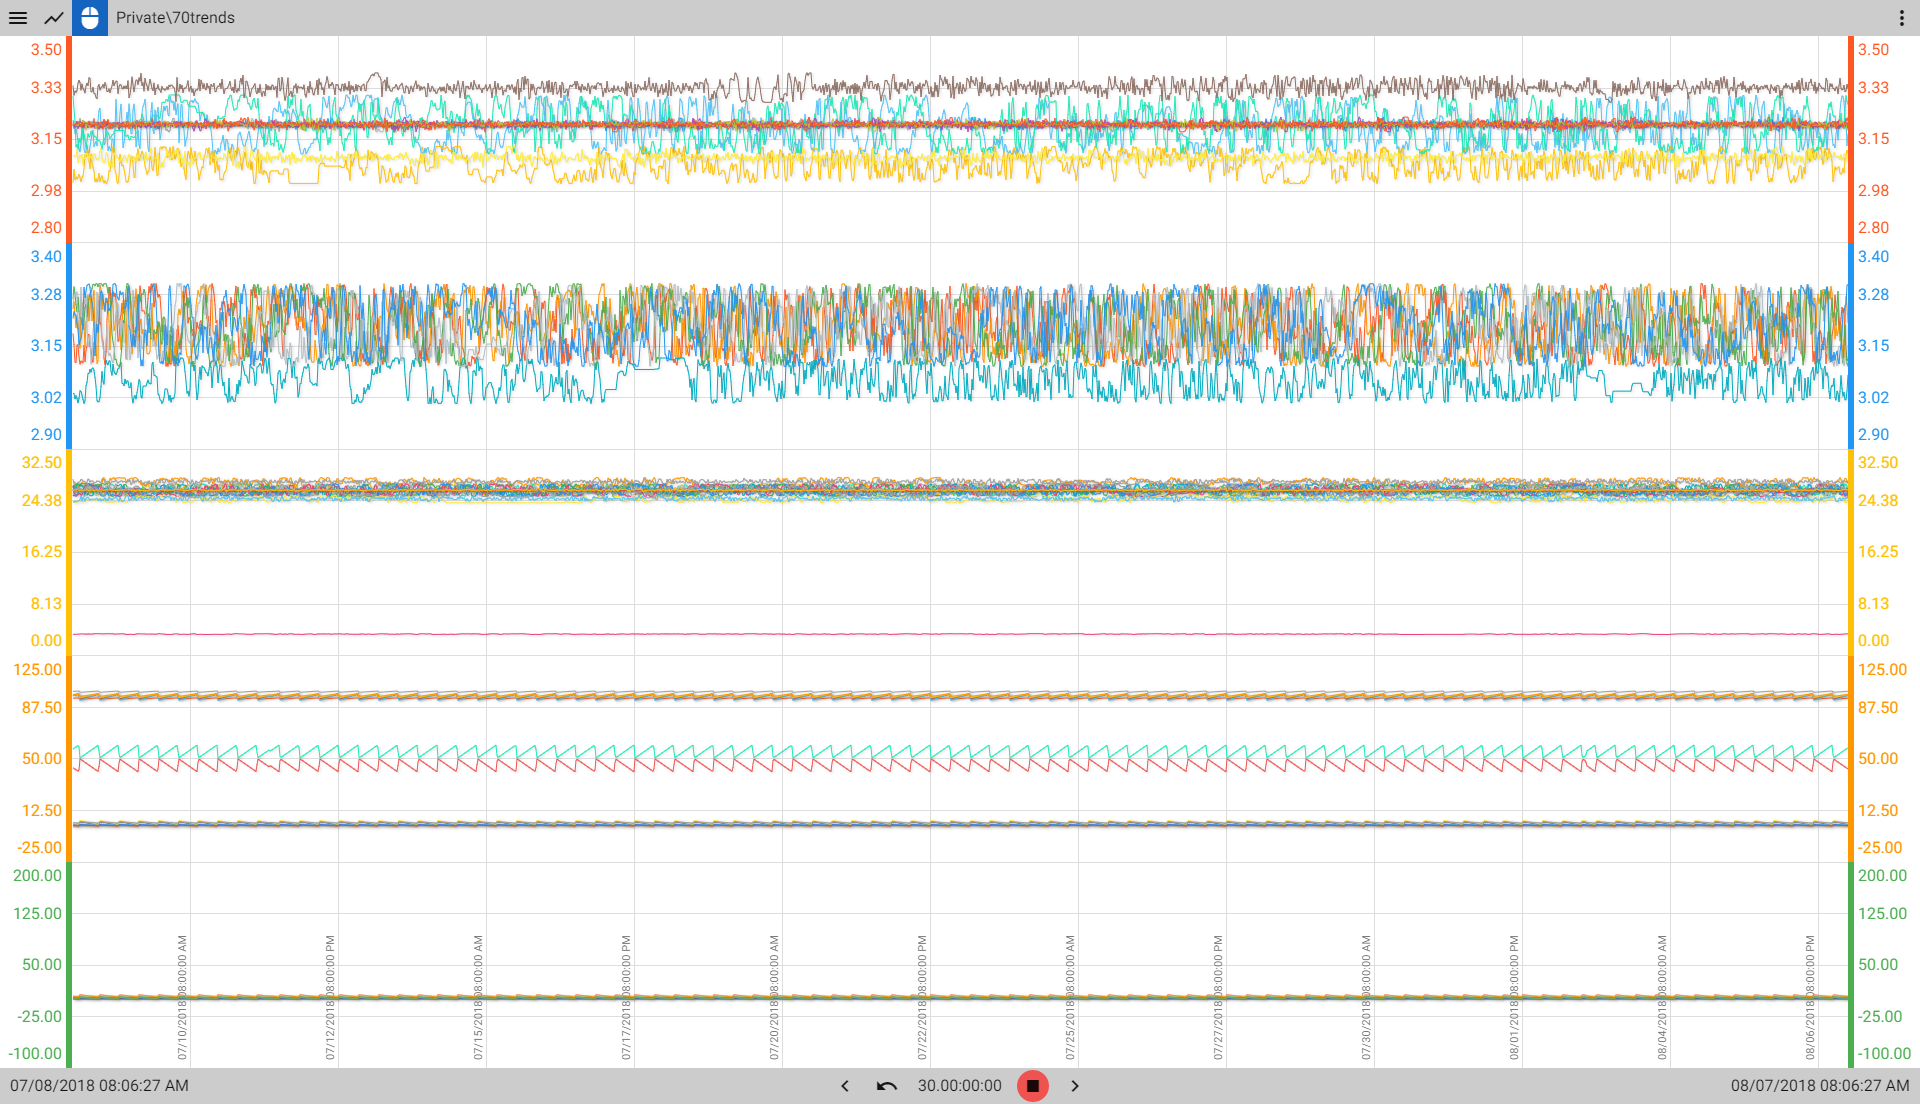
Trend 30 Days of Data for 70 Tags

Here was the idea.  Let's show how Axiom would perform if we placed 70 individual trends on a single chart.  Each trend polls at one second intervals and updates 100% of the time.  Then, once we have all 70 trends on a single chart, let's call for 30 days of historical values. 

Here was the idea.  Let's show how Axiom would perform if we placed 70 individual trends on a single chart.  Each trend polls at one second intervals and updates 100% of the time.  Then, once we have all 70 trends on a single chart, let's call for 30 days of historical values. 

How will Axiom respond to a request for over 180 million values?


In 12 seconds the Axiom chart was able to query and recall more than 180 million values from the Canary System.  Learn more about Axiom or try it for yourself.

canarybird

The Data Historian for Industrial Automation

With only 3 steps, we make maximizing the value of your process data simple.

LEARN MORE

Make It Easy To Use Your Time-Series Data

TRY CANARY

Most companies are spending too much money on their data historians

VIEW PRICING