Often, Axiom trend charts end up face-plated or embedded within SCADA packages and provide crucial data to engineers via HMI screens.
The challenge that most SCADA designers face when embedding a third party product into an existing SCADA platform is how to do so without creating unnecessary amounts of work. Particularly, how to script existing SCADA objects to pass historical data requests to the trend chart.
Axiom has a great feature that will lighten make this task easy, URL parameters. You can simply create a default Axiom trend chart, absent any specific tags, but formatted to your preferences... think legend placement, draw style, etc.
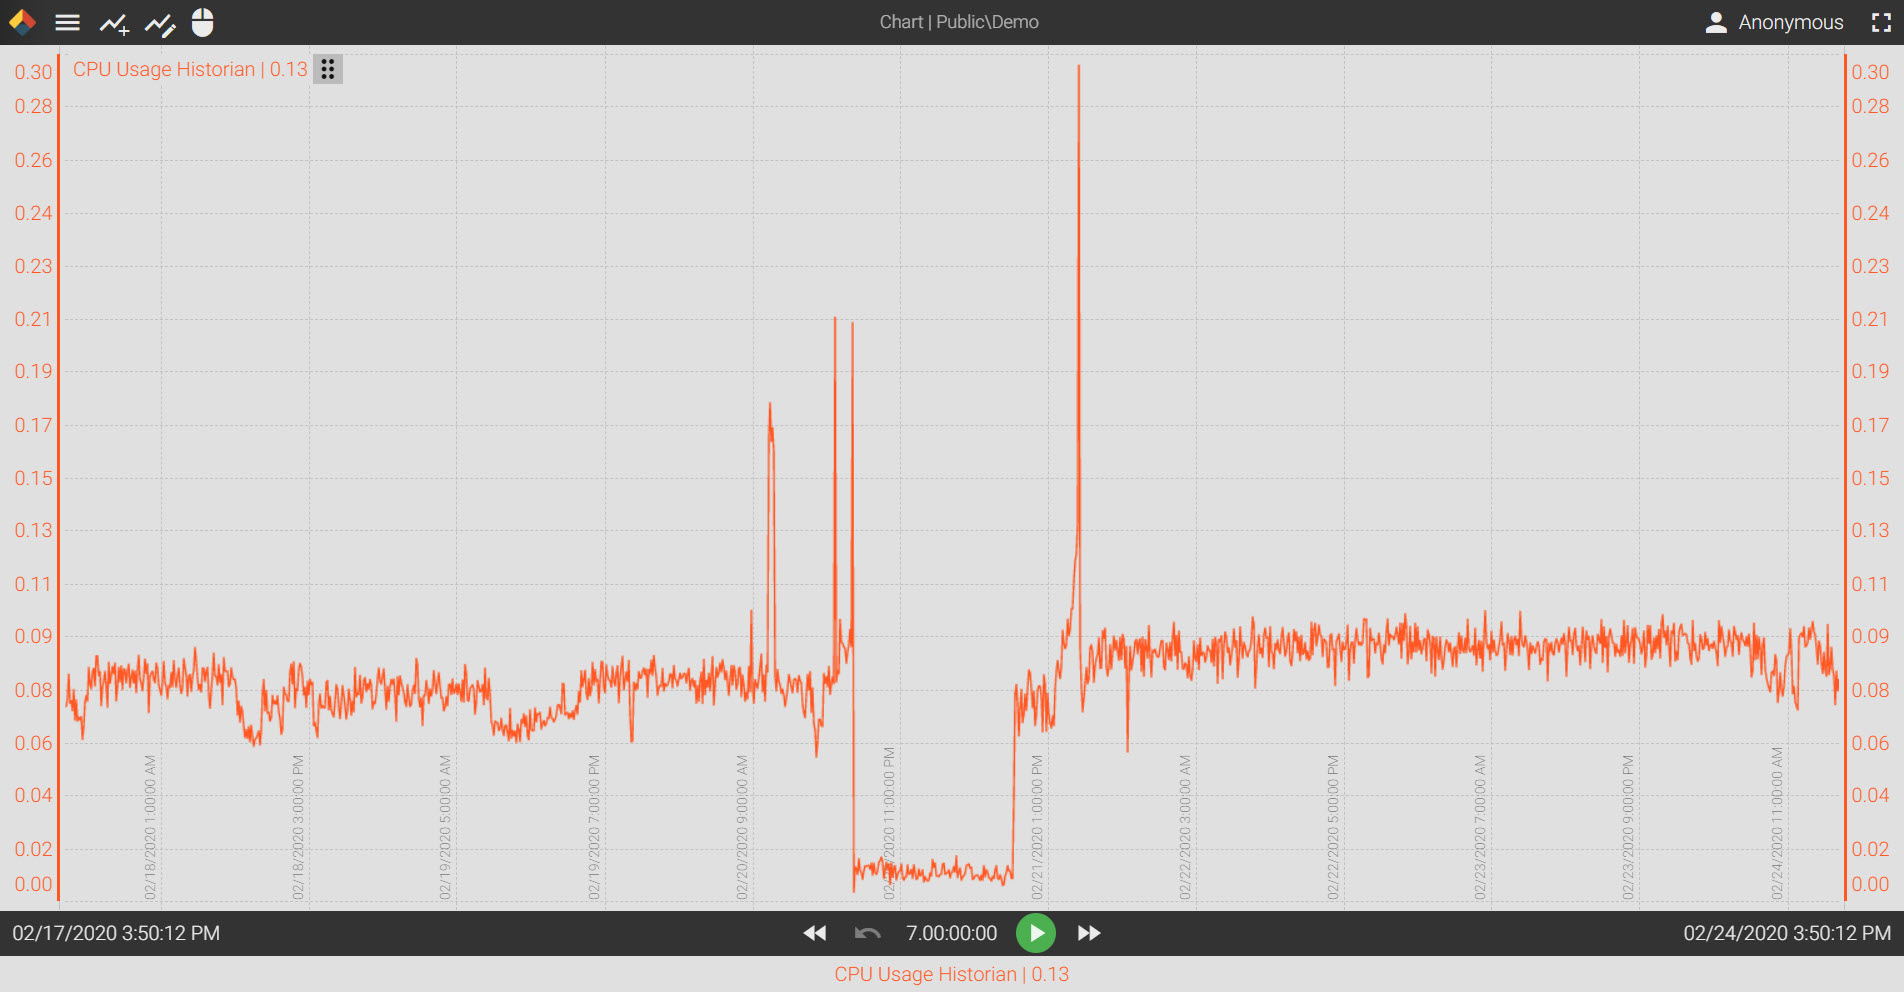
For the example in the video below, we have saved this chart in the Public directory with the name 'Demo'.
The first example of a URL parameter will allow you to pull this chart by adding it to the name of the historian in the URL address. Our historian is local, so the machine name 'localhost' will work.
To add the chart, we do the following:
http://localhost#chart=Public\Demo
Next, we make a requests for a tag. I can add to the URL using &tag= and then the tag path
http://localhost#chart=Public\Demo&tag=localhost.{Diagnostics}.Sys.CPU Usage Historian
(spaces are OK, the system will automatically format them once the URL path is executed)
You can also requests multiple tags; simply add square brackets after &tag and then the corresponding tag paths:
http://localhost#chart=Public\Demo&tag[]=localhost.{Diagnostics}.Sys.CPU Usage Historian&tag[]=localhost.{Diagnostics}.Sys.CPU Usage Total
Additionally, you can also select whether the chart should be in 'live mode' using the &livetime=true parameter or the overall chart duration using &duration=30m Time periods are handled using 's' for second, 'm' for minute, 'h' for hour, or 'd' for day.
So to call a single trend with a 8 hour duration and have it in live mode you would use the following:
http://localhost#chart=Public\Demo&tag=localhost.{Diagnostics}.Sys.CPU Usage Historian&duration=8h&livemode=true
You can also choose a specific date and time for the right edge of the chart, also called the 'live edge'. To do this, use the &livetime= feature. To call a trend that shows the entire day of February 1st, use the following:
http://localhost#chart=Public\Demo&tag=localhost.{Diagnostics}.Sys.CPU Usage Historian&duration=24h&livetime=02/01/2020 11:59:59 PM
You may find that some SCADA applications use iframes and as a result, the Axiom Core is not aware when an Axiom client is no longer being used. A helpful tool is the timeout parameter, &inactiveTimeout=
You can add a 4 hour timeout of the Axiom client which would require the end user to click 'Refresh' if they do not interact with the chart within a 4 hour period by doing the following:
http://localhost#chart=Public\Demo&tag=localhost.{Diagnostics}.Sys.CPU Usage Historian&inactiveTimeout=4h
Axiom's URL parameters give you the ability to write basic script in your SCADA application and send as many data feeds to a single trend chart instance with very little work.


